Forex candlestick patterns are the famous Japanese method to identify a possible trade on forex. To work on candlestick pattern you do not need to do any calculations. You can identify the pattern by using your naked eye. In other way you can tell its a method to observe price fluctuation for various currency pairs of forex, it’s also works on stock or other trading charts.
An introduction to forex candlestick patterns
First you have to understand candlestick chart before understanding the candlestick pattern. Below you will find two candles one is a bull candle, colored as yellow and the other is bear candle colored as red.
A particular candle comes up with 4 types of price or information. The high price, the low price, the open price and the close price. If you are observing an H1 candle then
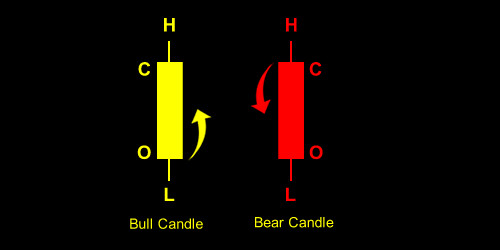
- the high price(H) is the highest price for that hour or sixty minute time period.
- The low price (L) is the lowest price for that hour or sixty minute time period.
- The opening price (O) is fixed for that time period, its the open price for that hour or for that candle
- The closing price (C) is the closing price of that H1 candle
For a bull candle opening price (O) is always lower than the closing price (C) and for a bear candle opening price (O) is greater than the closing price (C).
Engulfing candle pattern
Bullish engulfing candle pattern
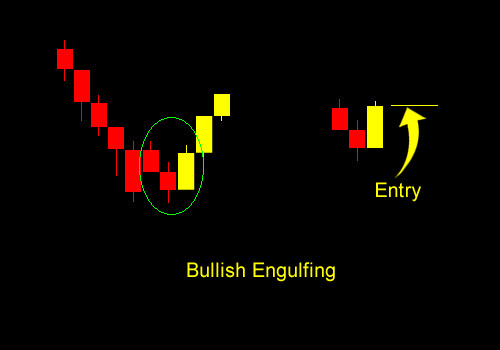
Bullish engulfing candle pattern consists of two candle sticks on a chart. On a downtrend market if a bear candle immediately followed by a larger bull candle then this particular pattern occurs. It means the bull candle engulfs the bear candle. It tells us that a possible uptrend market might come in near future.
Bearish engulfing candle pattern
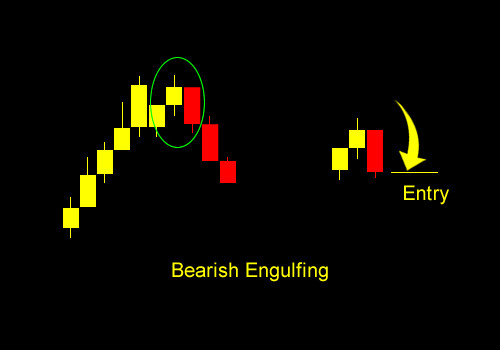
Bearish engulfing candle pattern is just the opposite of the bullish engulfing candle pattern. On a up trend market if a bull candle immediately followed by a larger bear candle then this particular pattern occurs. It means the bear candle engulfs the bull candle. It tells us that a possible down trend market might come in near future as bullish trend lost is momentum.
Morning and evening star candlestick pattern
Morning star candlestick pattern
Morning star candlestick pattern tells us a possible bullish trend is coming after a bearish trend. This famous pattern consists of 3 candlesticks. The first candle stick must be a bear candle, followed by a spin tops candle with a small body and the third candle is a bull candle whose closing price is just above the mid point of the first bear candle.
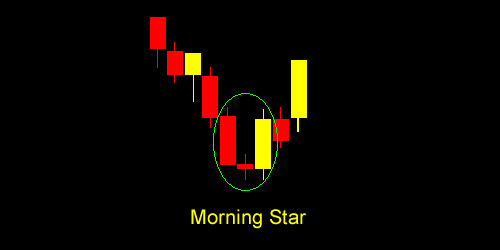
After a bear candle when we see a spin tops candle, it indicates that the market is in indecision mode and after spin tops candle when the immediate bull candle closes above the midpoint of the last bear candle of the trend it indicates that a possible long trend is coming and this pattern is known as famous morning star candlestick pattern.
Evening star candlestick pattern
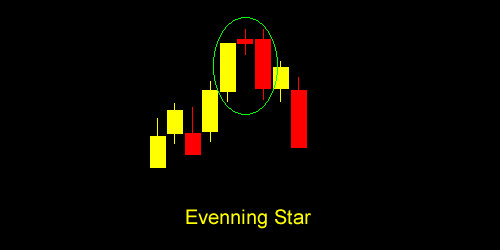
evening star candlestick pattern is just the opposite of morning star candle pattern. This pattern occurs at the end of a up trend and indicates that a possible down trend is coming. The patter formed this way, the last bull candle followed by a spin tops candle with a small body and the last candle is a bear candle whose closing price is just below the mid point of the last bull candle.
Three inside up and down candle pattern
Three inside up candle pattern
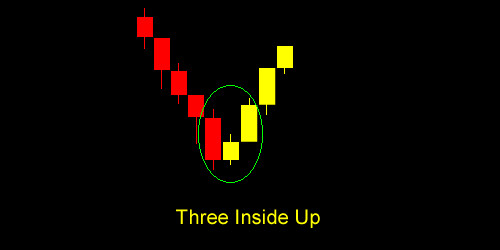
Three inside up candle pattern also found at the end of a down trend market. The first candle must be a tall bearish candle followed by a bull candle which closes above the mid point of the bear candle and the third candle will be a nice bullish candle which closes above the opening of the first candle.
Three inside down candle pattern
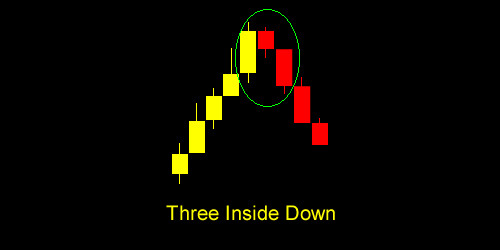
Three inside down candle pattern is just the opposite of the three inside up candle pattern. We found it at the end of a up trend market, that means at the beginning of a down trend market. The first candle must be a tall bullish candle followed by a comparatively small bear candle which closes below the mid point of the bull candle and the third candle will be a nice bear candle which closes below the opening of the first candle.
Spinning tops candle pattern
Spinning tops candle pattern comes with a small body with a long lower shadow and a big upper shadow. It does not matter that whether its a bull candle or bear candle. Small body tells that market is in indecision mode, the long lower and upper shadow tells that both the buyer and seller tried to take control of the market but both failed in the current session.
When we find a spin tops candle pattern in the way of a up trend we can tell that buyer is lost its power and there might be a possible reversal. When we find spin tops in the way of a down trend we can tell that seller is lots its power their might be a possible reversal to uptrend.