We are in bullish mode on EURUSD currency pair
Here is the illustrations and snapshots for EURUSD Forecast and technical analysis May 19 2014
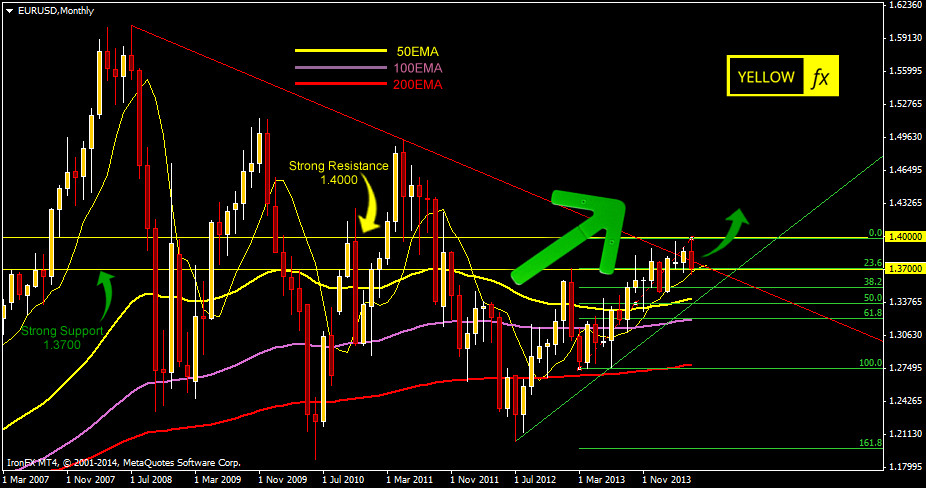
On the monthly chart of EURUSD pair we can see that the pair broke the red strong trend line but it failed to keep its momentum due to dovish act from Draghi. But the setup is still bullish.
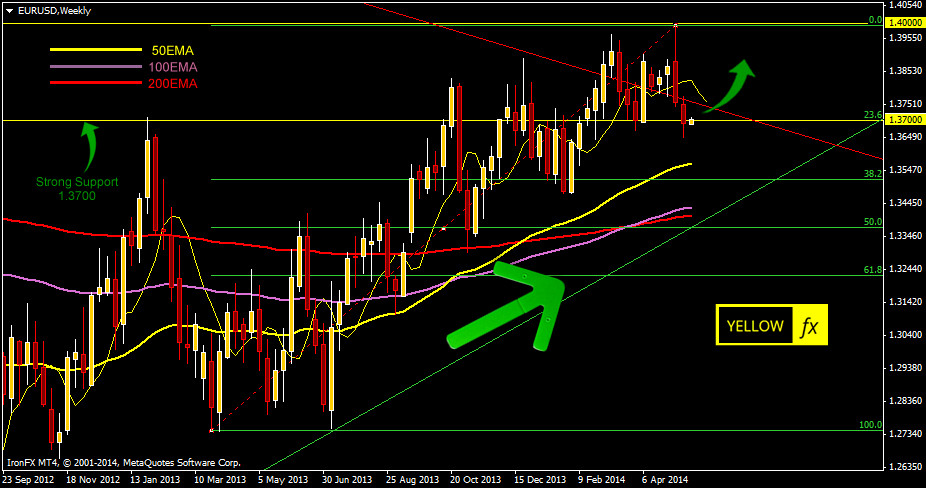
On the weekly chart of EURUSD pair we can see that the market still holds the 1.3700 level. If it breaks this level it might be a trend change situation for this pair.
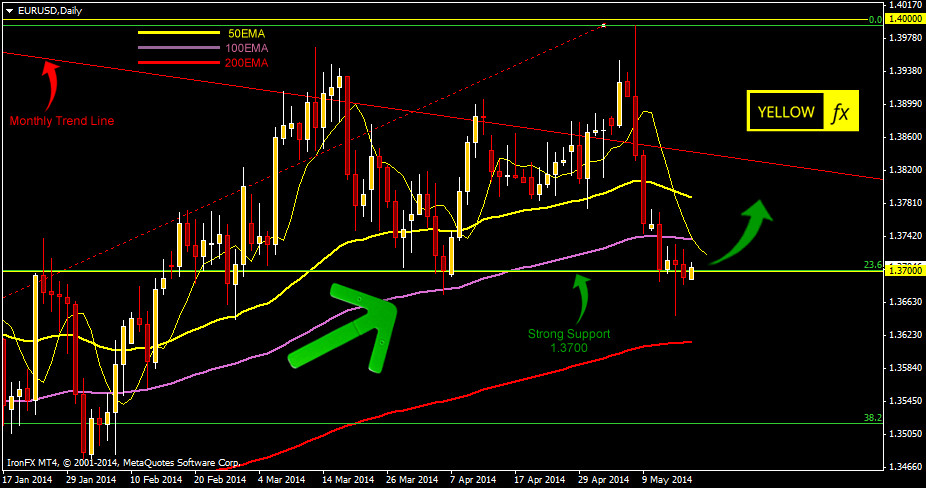
On the daily chart we can see that the pair still holds the strong 1.3700 support level and below this level still we have a 200EMA support level. The break of these two levels will be the start of downtrend on this popular currency pair.
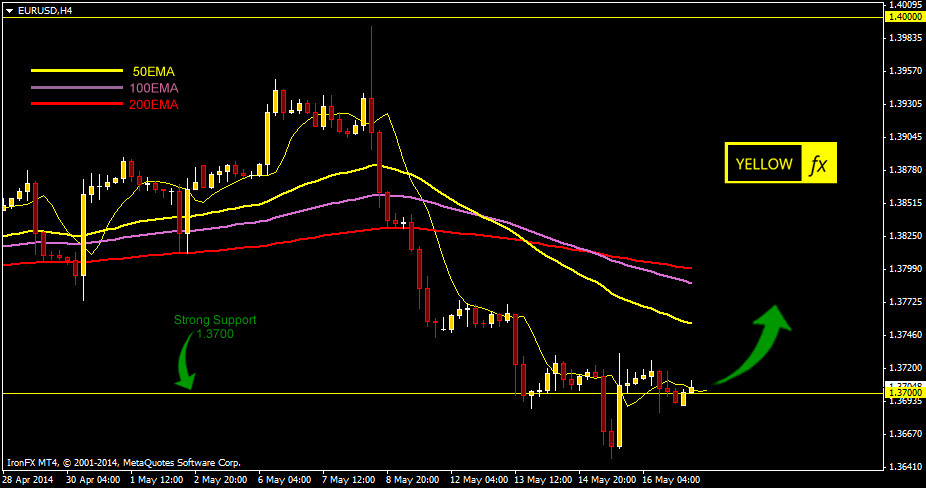
On the h4 chart we can see that market is not a good shape to go for long on this pair, though we are still bullish on this pair but it will be wise to wait for couple of days to go for long on this pair.
We are in bullish mode on NZDUSD currency pair
Technical analysis for NZDUSD
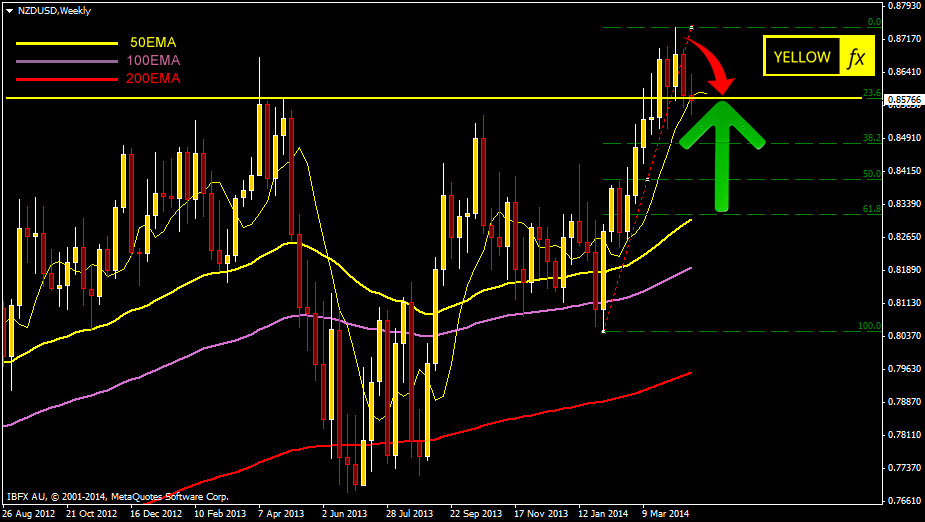
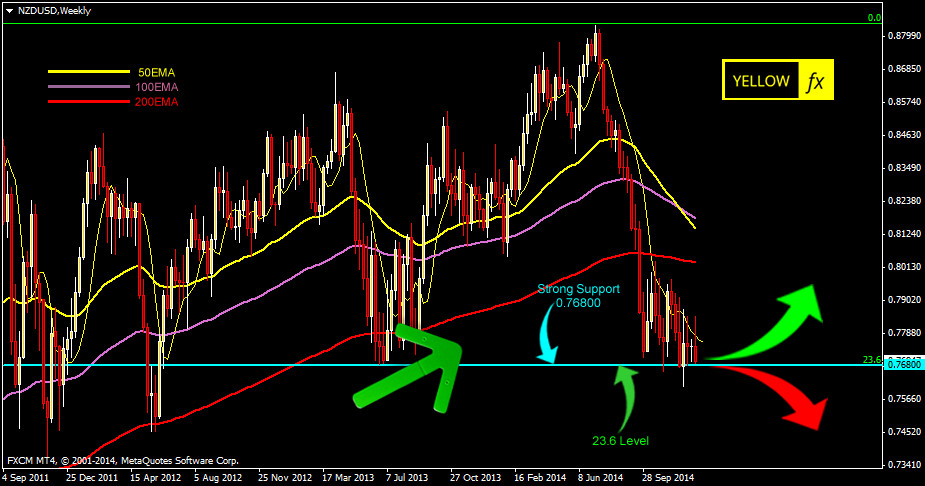
Tough one weekly chart it shows a slightly fall indication but for me NZDUSD is certainly bullish. Its currently experiencing a Fibonacci 23.8 level resistance on weekly chart.
On the daily chart its just bouncing from the 50EMA and at the same time its experiencing a Fibonacci 23.8 level as a strong resistance.
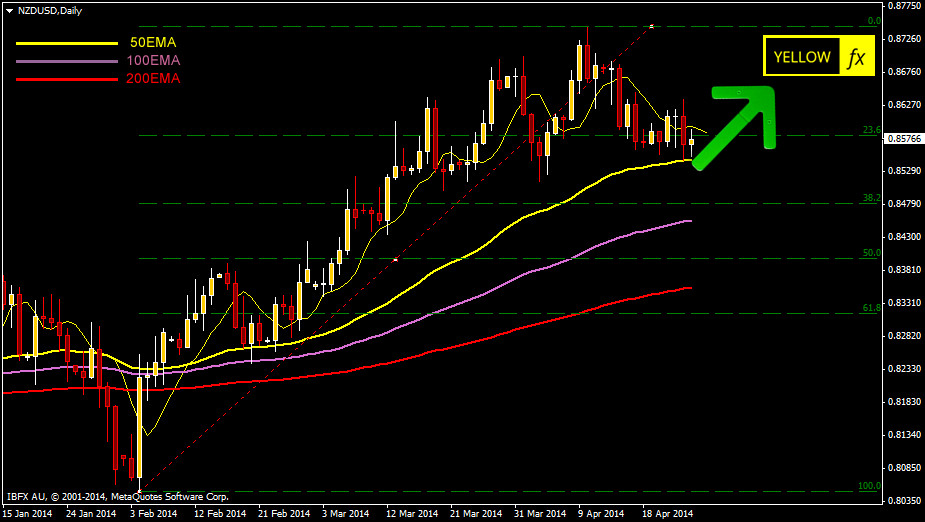
So technically we can see all the bullish indication on NZDUSD pair.
We are in bullish mode on USDJPY currency pair
Here is the illustrations and snapshots for USDJPY Forecast and technical analysis May 5 2014
USDJPY Forecast and technical analysis May 5 2014
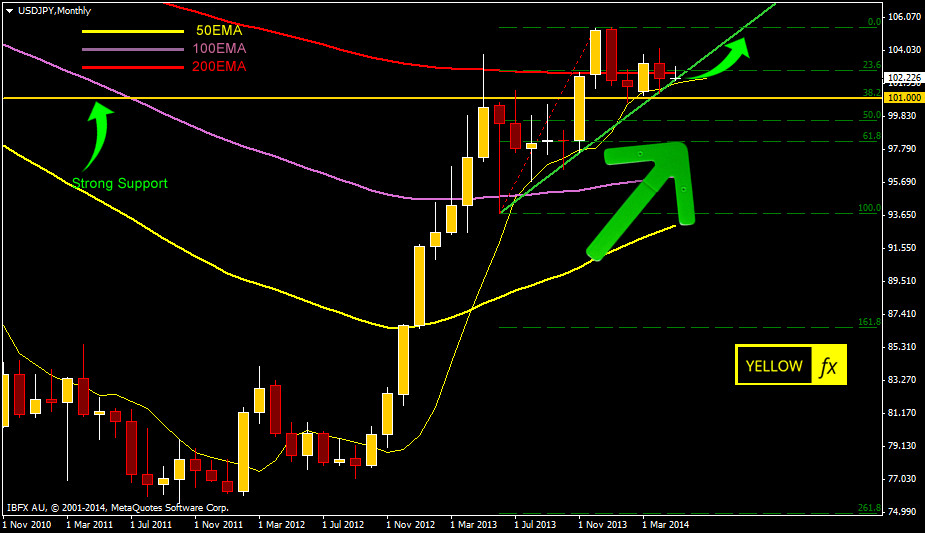
On monthly chart we can see that USDJPY currency pair still holding its monthly trend line support, the green line on the chart. So still its on bullish mode. Current range situation may be a temporary holdings of long term usdjpy long trend. It might gather its power and can shoot up wards any time. On the other hand its still holding the crtical 101.00 support level.
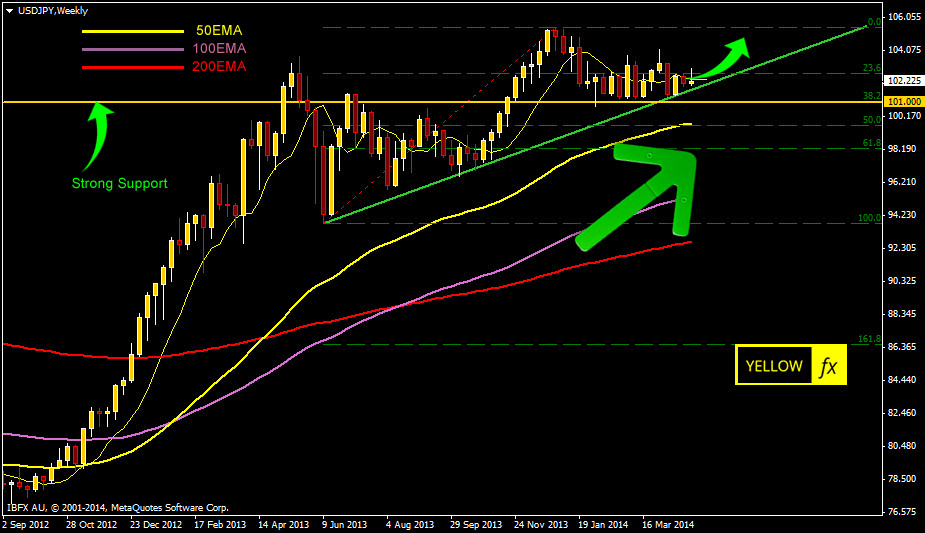
On weekly chart we can clearly see that USDJPY currency pair clearly established the 101.00 support level. Current ranging situation can break any time and we are favoring a strong upward move.
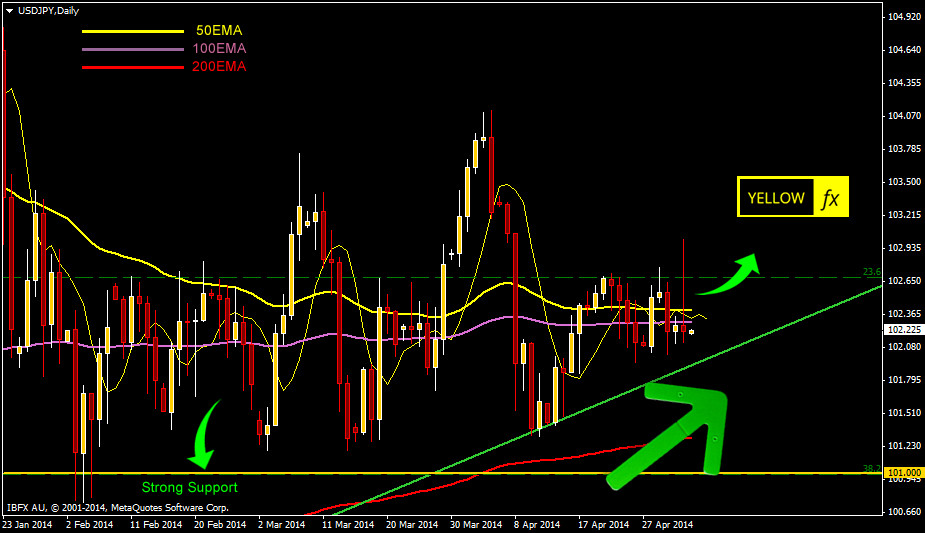
On daily chart we can see a ranging situation but still bullish trend is our favorite.
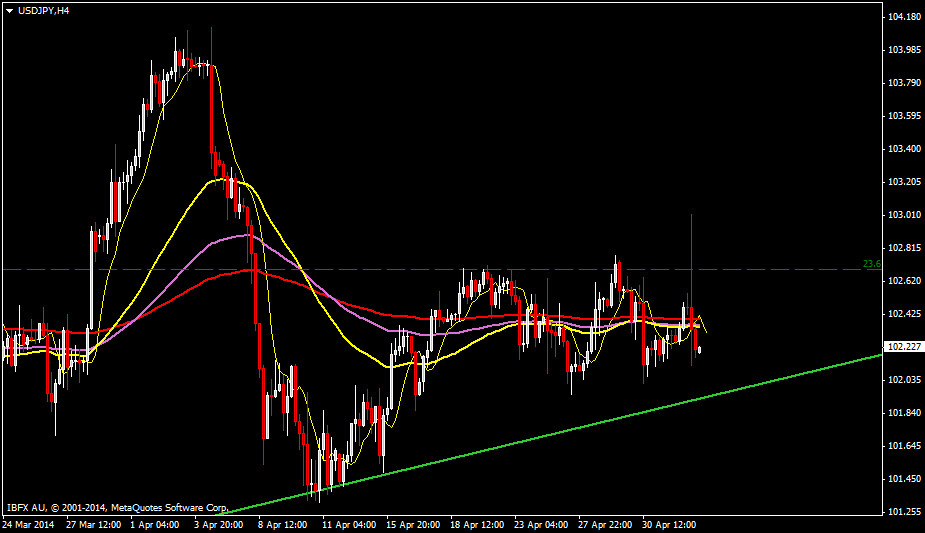
On h4 chart we can see an entry point market is just above the green monthly trend support line.
Though USDJPY is ranging for last couple of weeks but still we are favoring a bullish trend for usdjpy currency pair. A couple of good USD news might give a very big upward movement for this currency pair.
We are in bearish mode on NZDUSD currency pair
Here is the forex forecast and NZDUSD technical analysis for NZDUSD January 5 2015. Below you will find illustrations forex analysis of NZDUSD on various time frame. We tried to graphically illustrate our forex analysis for NZDUSD so that you can logically understand the significance of our analysis.
NZDUSD weekly forecast and technical analysis
NZDUSD pair still following our last few analysis. On the weekly chart of this pair ,there is a strong monthly Fibonacci level 23.6 support at 0.76800 price level. USD is strongly bullish mode, we are expecting that the pair will break the level and continue the downtrend to 0.73500 price level that is Fibonacci level 38.2. We will wait a bit for the definite crossing of 0.76800 price level and only then we can go short on this pair.
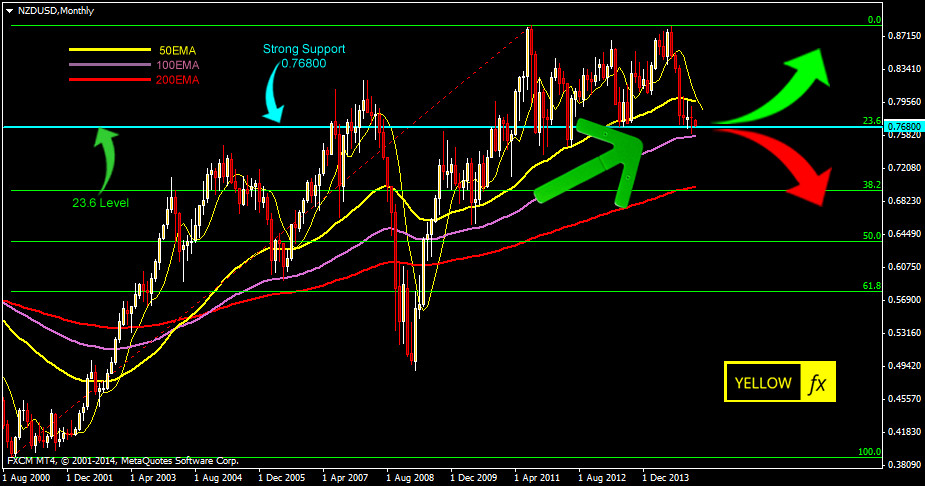
On the monthly chart of NZDUSD pair, market is still hanging on the monthly 23.6 Fibonacci level. It is waiting to break the level. Today we will find a new monthly candle if it opens below that 23.6 level of 0.73500 level then it might be an indication of further down trend on NZDUSD pair.
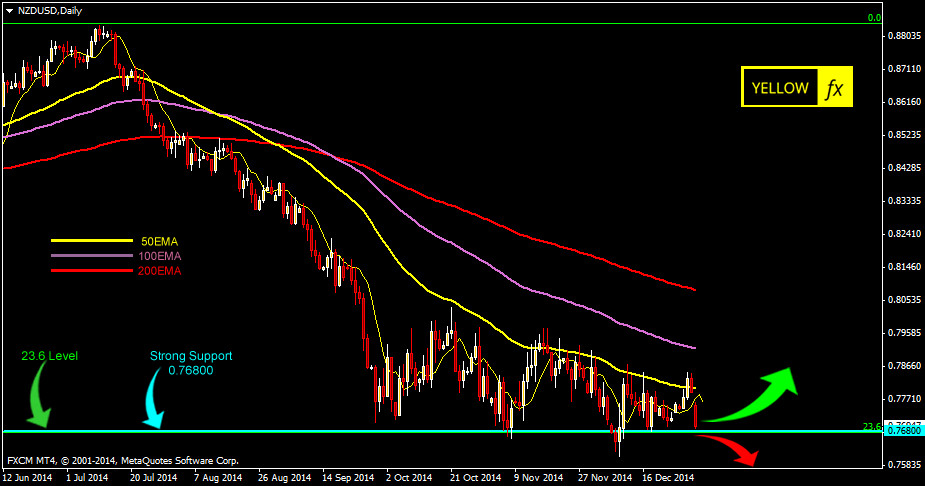
NZDUSD daily forex forecast forex technical analysis
The daily chart of NZDUSD pair shows us that market is testing the current support level 0.735000 level and its ranging. But as we already told we are expecting that strong USD dollar will break this support level and the pair will fall further down.
On the H4 chart, the market is ranging in our that given level. Market for NZDUSD is still undecided. The first trading day of this week is very important as it might gives us a decision or give us a new signal for a short trade.
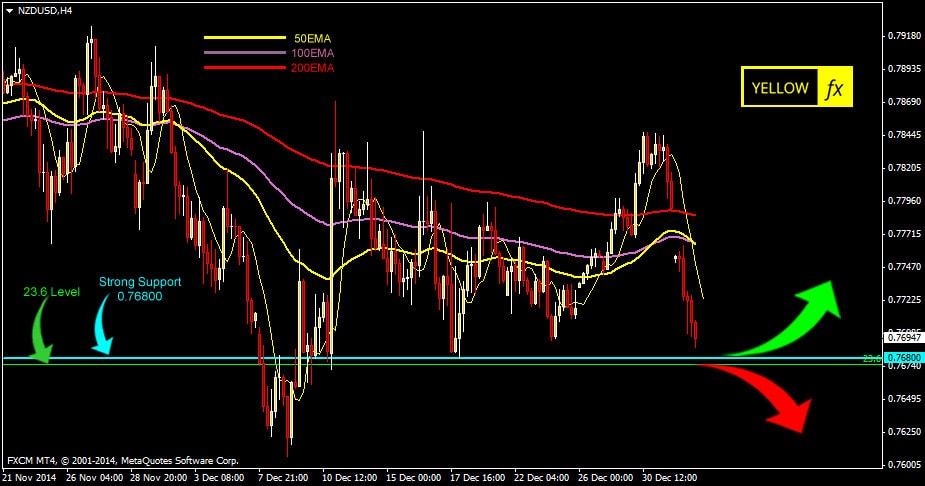
Team YellowFX is bearish on NZDUSD currency pair. Most of the charts shows that the market is trying to break that monthly 23.6 Fibonacci level. Still its unable to break that level. But today we will see a new monthly candle and it might break that level. We have to wait and see.
We are in bullish mode on GBPUSD currency pair
Technical analysis for GBPUSD
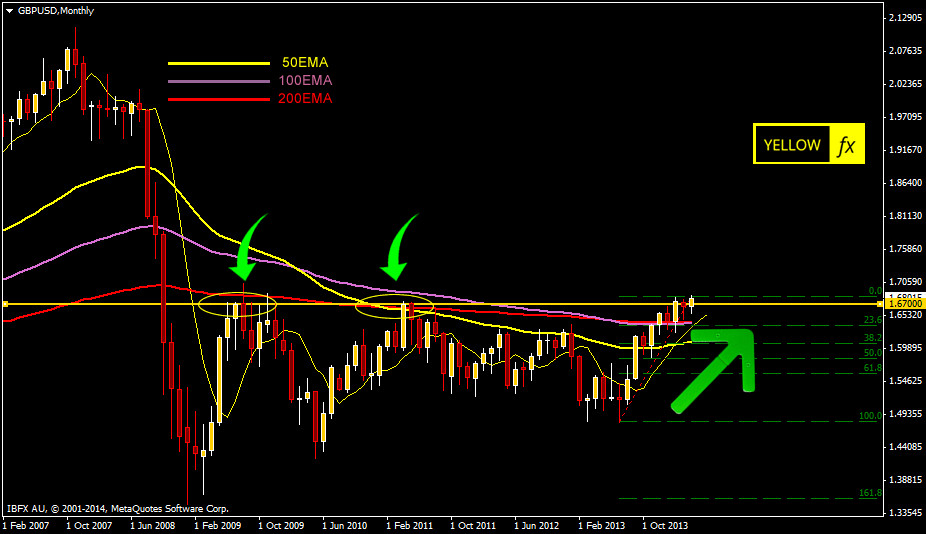
On monthly chart GBPUSD is just breaking a strong resistance point 1.6700. We have to wait till the end of this month, if the next month candle opens above the 1.6700 line it will give us an indication for stronger GBPUSD in the coming 1 or 2 months.
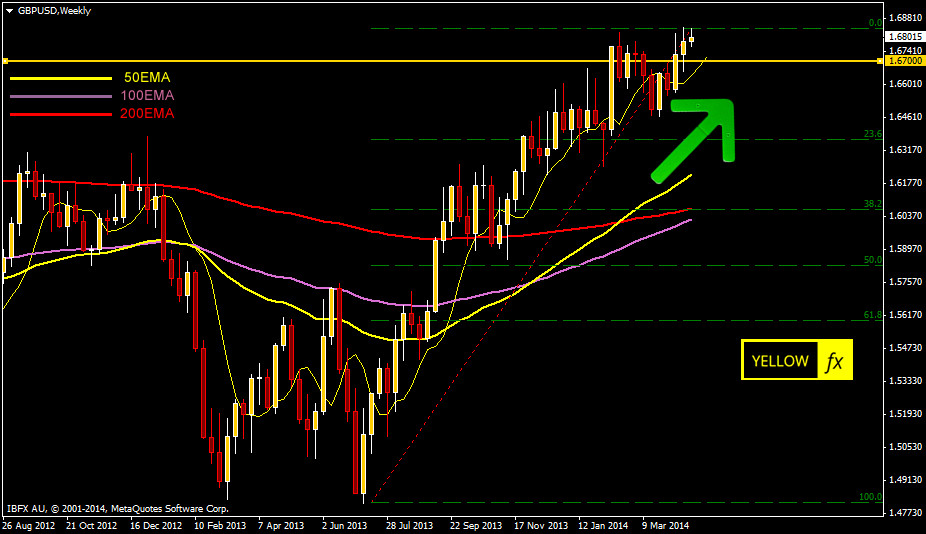
Weekly charts already confirmed that GBPUSD passed the critical 1.6700 line and the weekly candles are strongly bullish.
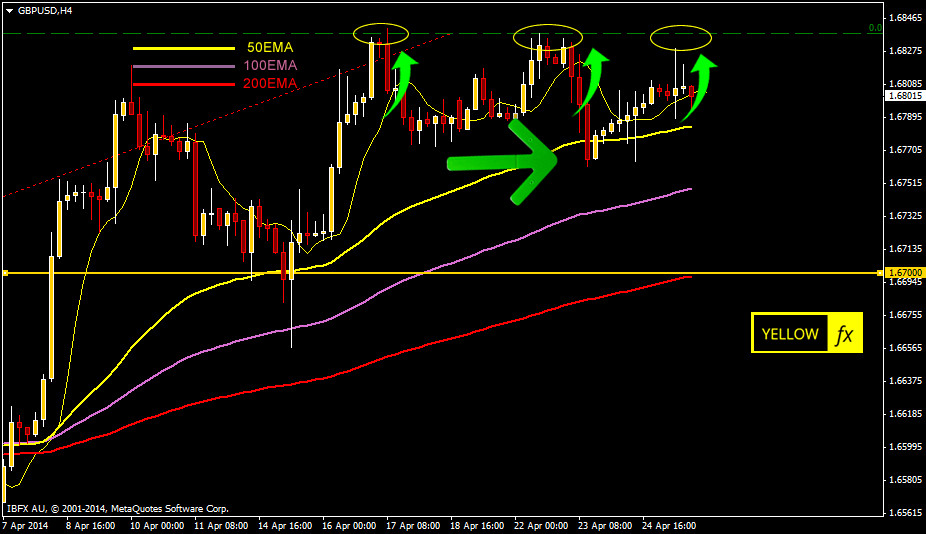
If we consider the H4 chart it seems a ranging situation. Its trying to 1.6840 level for the third time. But longer time frame is telling us the actual story. It might fall a bit but for us GBPUSD is strongly bullish.