We are in bearish mode on AUDUSD currency pair
Here is the forex forecast and technical analysis for AUDUSD currency pair December 22 2014. Below you will find illustrations and technical analysis of AUDUSD currency pairs on various time frame. We tried to graphically illustrate our forex technical analysis so that you can logically understand the significance of our technical analysis.
AUDUSD technical analysis on monthly chart
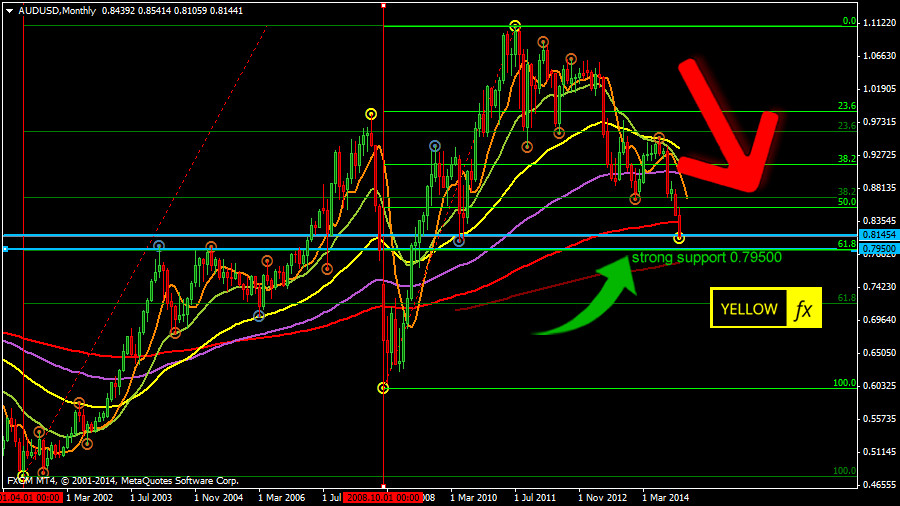
 On the monthly chart of AUDUSD price chart we drew two fibo levels. One from the April, 2001 and the second from the October, 2008. Coming price level 0.79500 is the golden combination of fibo 50 of 2001 and fibo 61.8 level of 2001. And team YellowFX is considering the 0.7950 level a very strong support for AUDUSD. But 0.7950 level is still 190 pips away and we will remain bearish on AUDUSD till that level.
AUDUSD analysis on daily chart
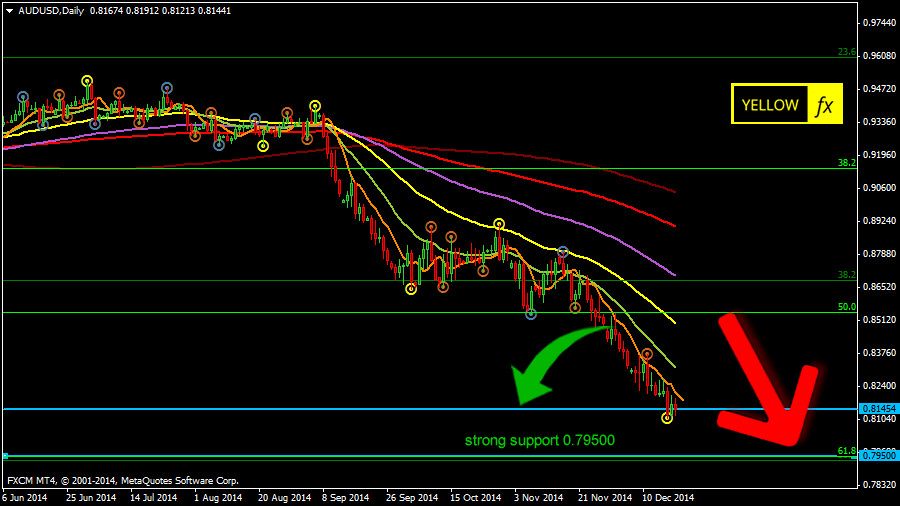
 On the daily chart of AUDUSD we can see that the pair is firmly falling towards the next support level that is 0.79500 level. The current position is a lucrative point for short position
AUDUSD currency pair on H4 chart
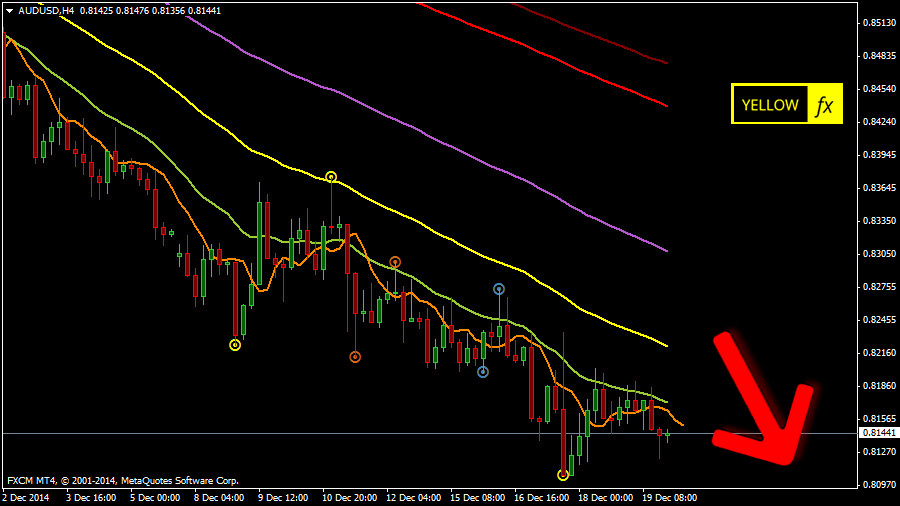
 On the H4 chart of AUDUSD we can see that market is nicely falling that is the continuation of D chart. For us the next market opening is the entry signal to go for short on this particular currency pair
Team YellowFX is possessing a strongly bearish sentiment on AUDUSD currency pair and Our stop loss level is abovle 0.82041 level and take profit level is 0.79500.
(adsbygoogle = window.adsbygoogle || []).push({});