We are in bearish mode on GBPUSD currency pair
Here is the forex forecast and GBPUSD technical analysis for January 5 2015. You will see a number of price chart on various time frame that we have been used on forex analysis of GBPUSD. We are trying to show our analysis graphically so that you can easily see and understand the main point of our analysis.
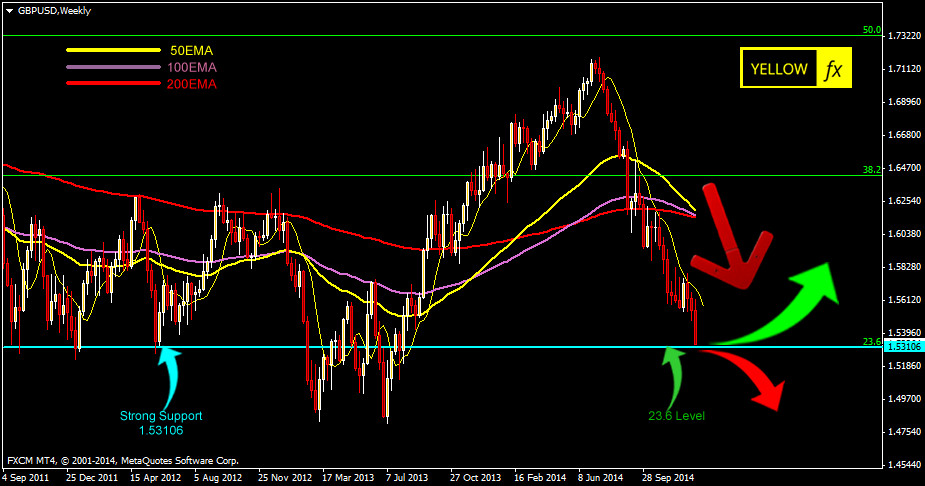
Weekly GBPUSD forecast technical analysis
GBPUSD piar is passing the the monthly Fibonacci level 23.6 that is 1.53106. Though this price level is suppose to be a strong support for the current downtrend, but we think it will break this level and market will fall more. It means a continuation of further down trend. This thing yet not finalized. We have to wait till a definite break of the current 23.6 level or price level 1.53106.

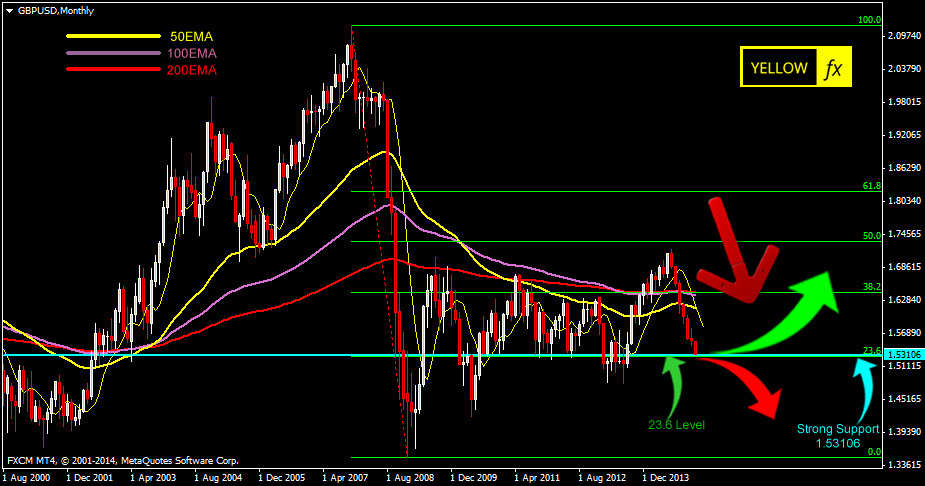
GBPUSD monthly technical analysis
On the monthly chart of GBPUSD piar, that market is experiencing the downward Fibonacci level 23.6, more specifically 1.53106 price level. USDDOLLAR is strongly bullish and we believe that market will break this support level and GBPUSD will fall further down.

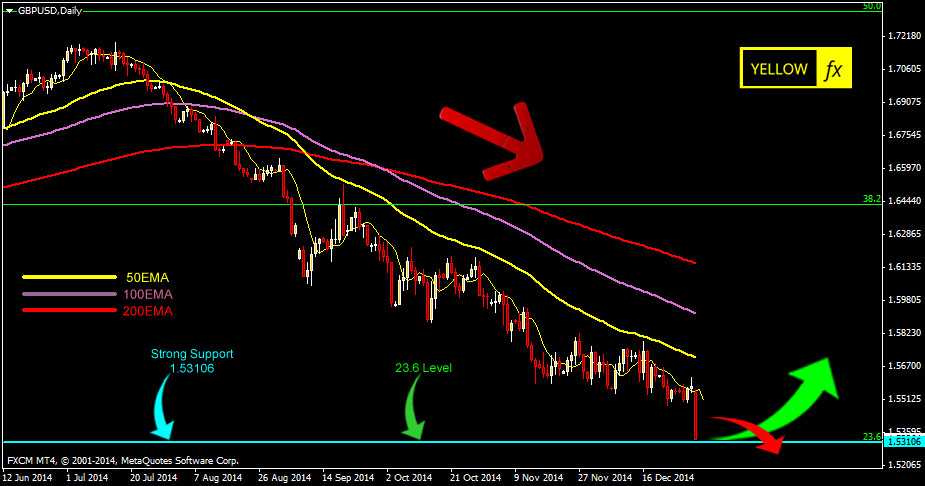
GBPUSD daily technical analyis and forex forecast
While we look at the daily chart of GBPUSD, that market is firmly falling, at the same time it is experiencing the support level 1.53106. Last trading day the pair made a huge fall and we are anticipating that the pair will fall more in coming days.

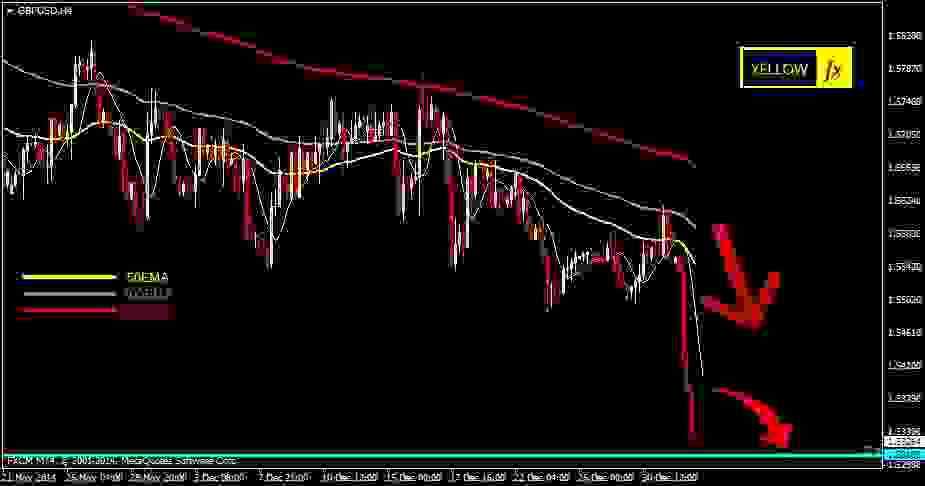
GBPUSD analysis h4
On the h4 chart of GBPUSD pair, that market is firmly falling. There is no sign for trend change in coming days. We have only one strong monthly support. But that seems to be broken easily with the current market flow.

Team YellowFX is bearish on GBPUSD currency pair. We have a strong support level on this pair that is monthly Fibonacci level 23.6, 1.53106 price level. But we are expecting more down trend on this particular pair.