We are in bearish mode on GBPUSD currency pair
Here is the illustrations and snapshots for GBPUSD Forecast and technical analysis December 15 2014.
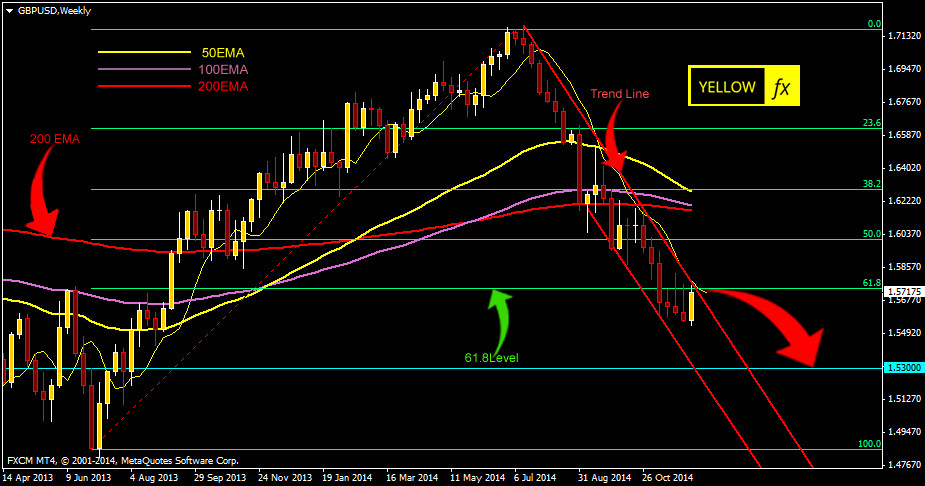
GBPUSD weekly technical analysis and forecast
On the weeekly GBPUSD chart we can see that, last week the pair is unable to break the fibo 61.8 level. It was also unable to break the current weekly downward channel. So till it crosses the fibo 61.8 level or it breaks the current down channel we will be remain bullish on this particular pair.

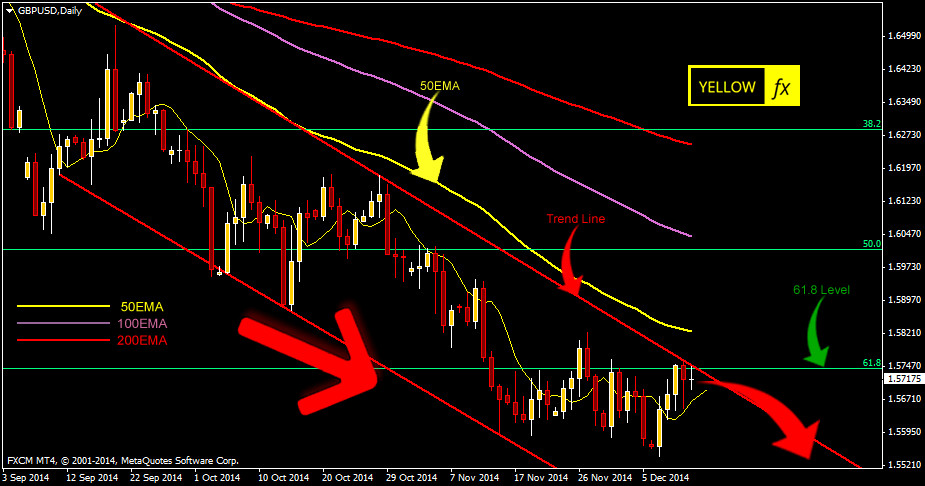
GBPUSD daily technical analysis and forecast
On the daily chart of GBPUSD we can see that the pair is still maintaining the nice down channel and there is no indication to go up from here unless it breaks the channel.

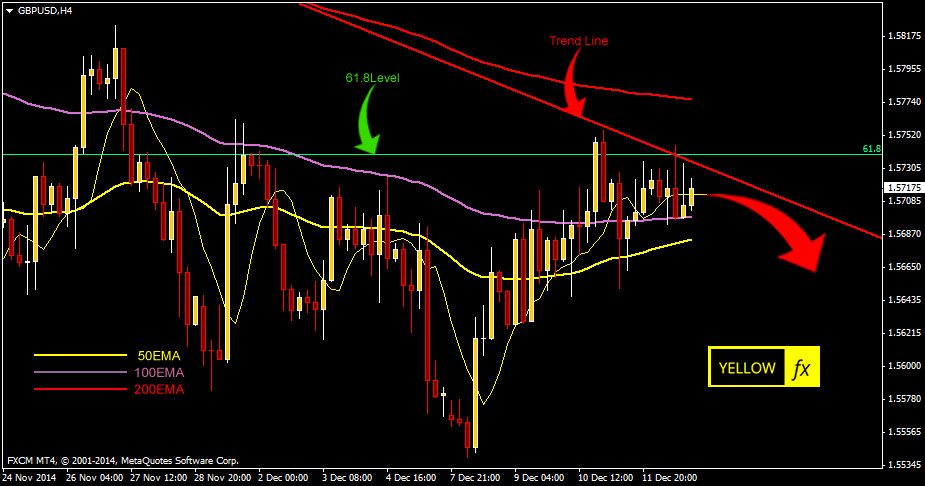
GBPUSD H4 technical analysis and forecast
On the H4 chart of GBPUSD pair we can see that its got some resistance at the upper down channel. But still the pair seems falling to us.
