We are in bullish mode on GBPUSD currency pair
Here is the illustrations and snapshots for GBPUSD Forecast and technical analysis May 19 2014
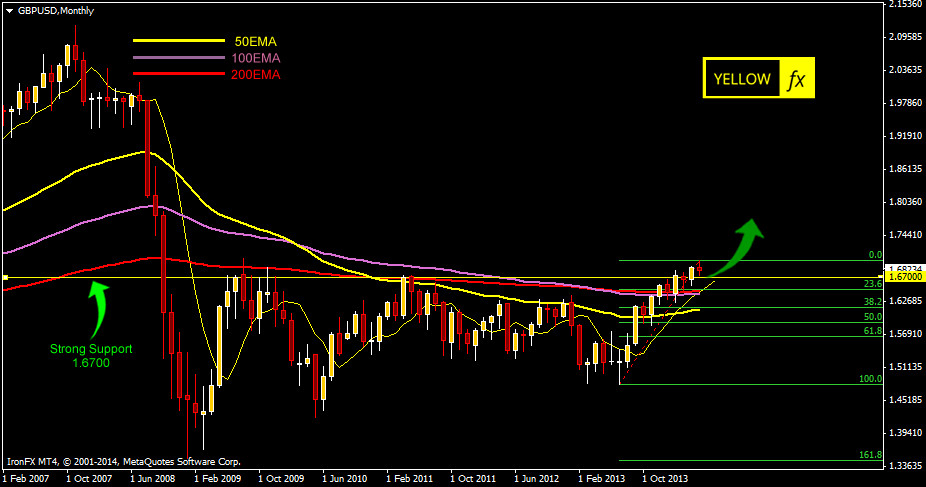
On the monthly chart of GBPUSD pair we can see that it broke the 1.6700 level. The recent crisis on EUR and USD made this currency the most safest to place trade.
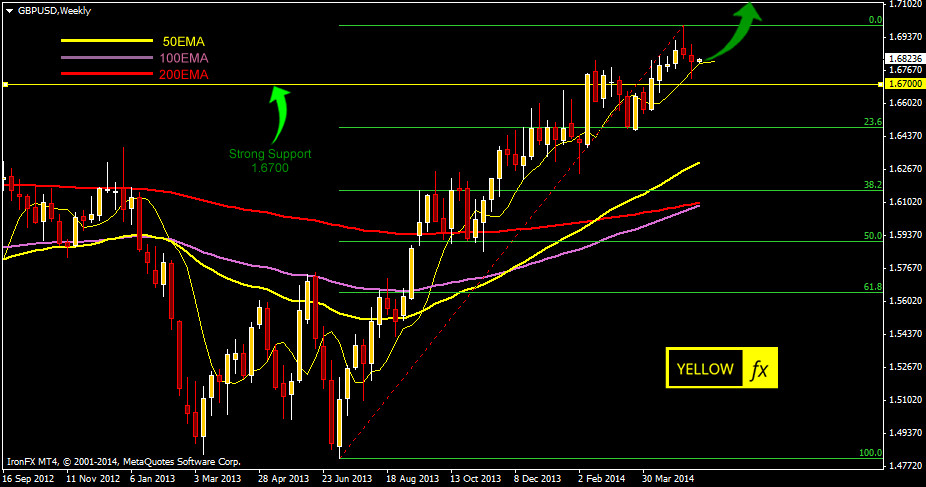
On the weekly chart we can see that the pair is just turning to go further up, a lucrative setup to make a long entry.
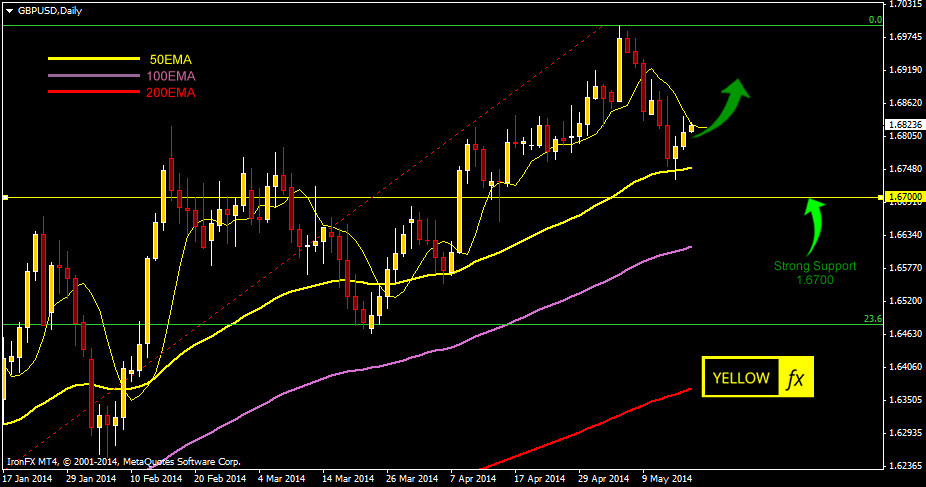
The daily chart of GBPUSD pair is also very strong for a bullish trend. The pair just bounced from the strong 50EMA level and made couple of nice bull candle.
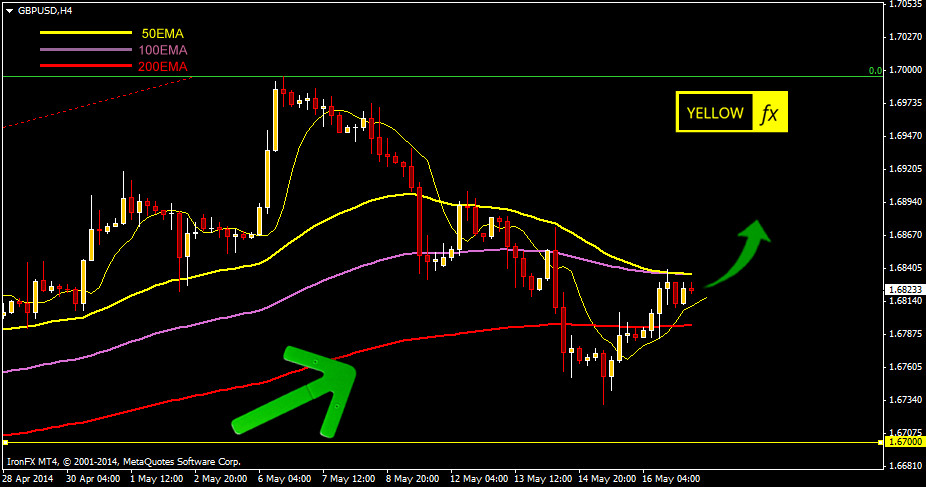
On the h4 char we can see that the pair is just below the 50EMA level. A break of this 50 EMA level will be a definite long for this pair.