We are in bullish mode on GBPUSD currency pair
Here is the illustrations and snapshots for GBPUSD Forecast and technical analysis May 5 2014
GBPUSD Forecast and technical analysis May 5 2014
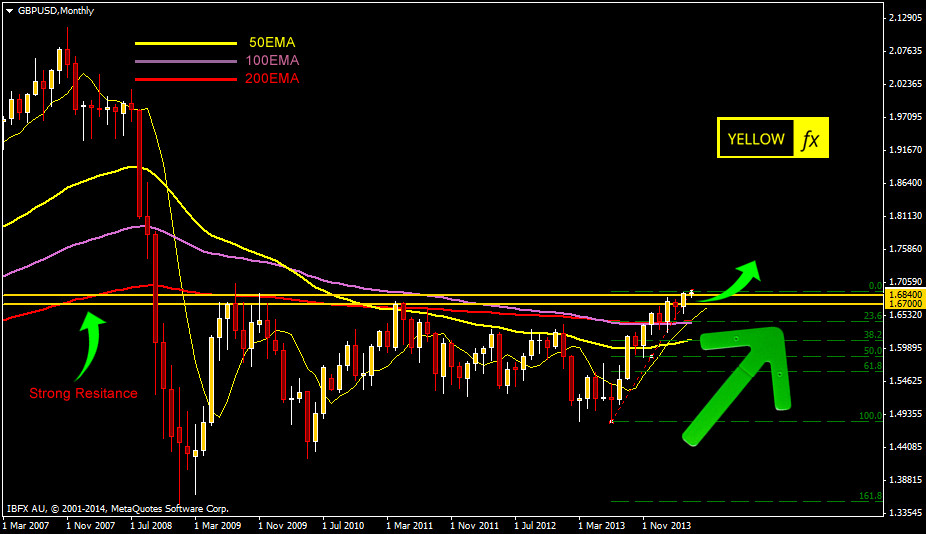
On monthly chart we can see the GBPUSD currency pair clearly broke the strong resistance level 1.6700 and its established its 1.6700 level as its new support level. GBPUSD clearly showing a bullish indication for long term. Recent unstable fundamental condition of EUR and USD made GBP a decent currency to load money on it. Last monthly candle is clear bullish candle too.
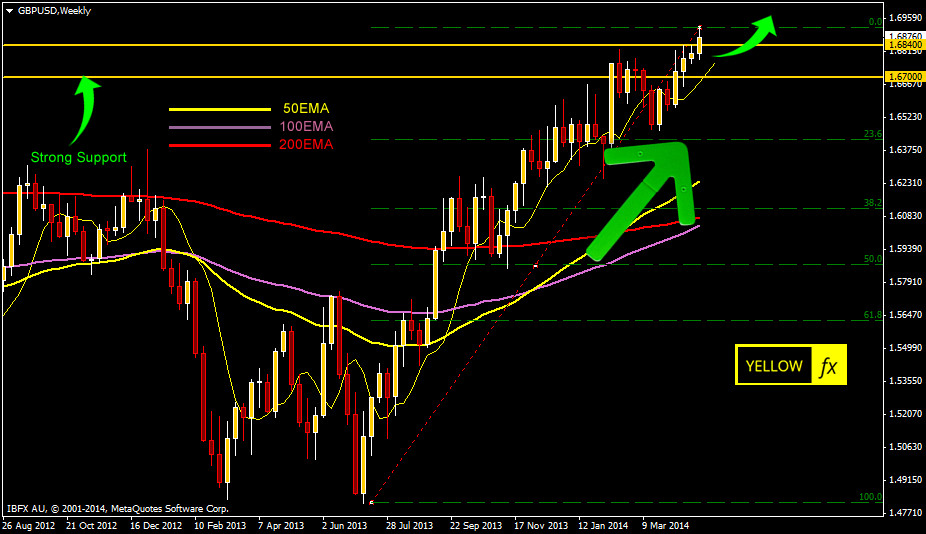
On weekly chart its just confirming the monthly bullish indication. Couple of strong bull candle gives us a fare indication of bullish trend.
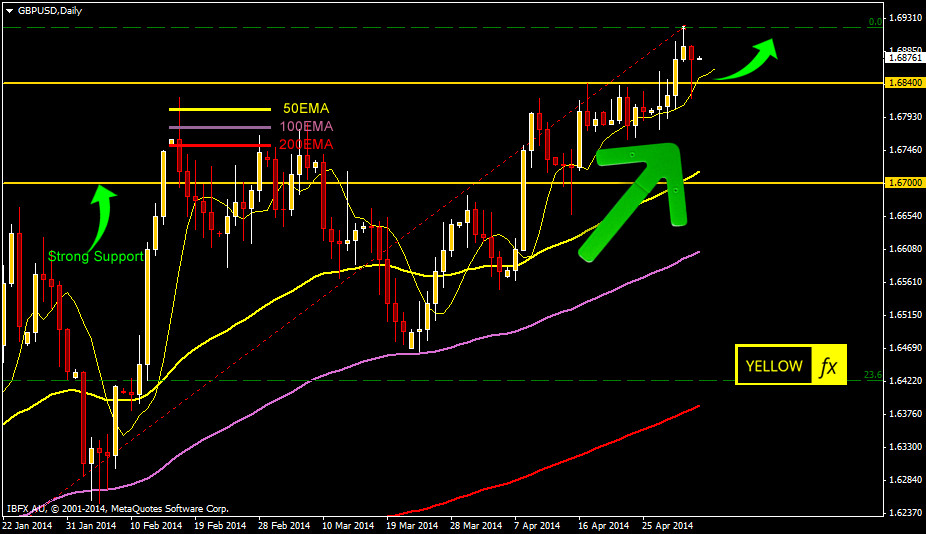
On daily chart its also indicating us a strong bullish chart
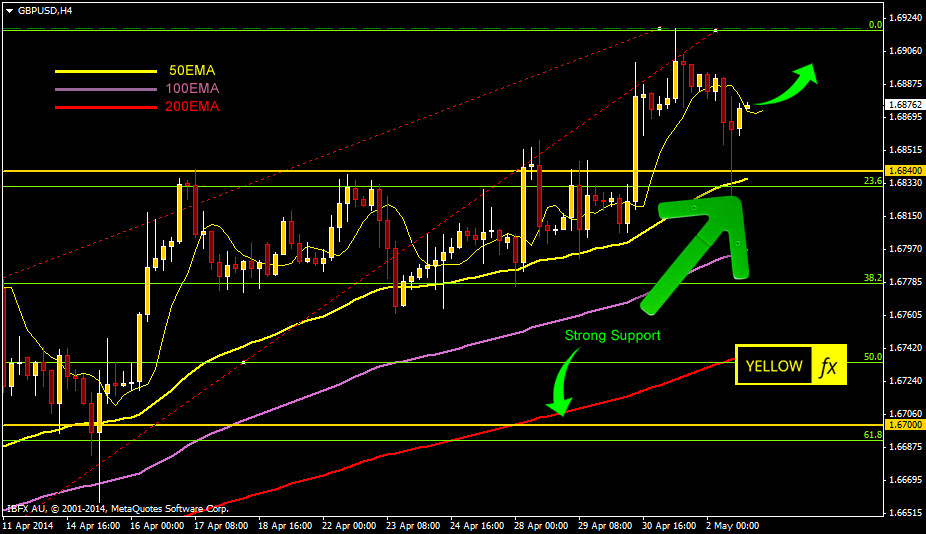
On h4 chart we can see market just bounced back from to 50 EMA, a good sign of upcoming bullish trend.
Over all impression is GBP is one of the most strongest currency for this time. Its this bullish journey started from the last 5 or 6 months and it seems still it has more pace to go further.